
Advertisement
Advertisement
The $3,500 Top in Gold and the Upcoming Slide in Commodities
Published: Apr 23, 2025, 19:31 GMT+00:00
Trump blinked. Just like I’ve been expecting him to, based on his previous approach to negotiations. This is profound.

Quoting today’s article from Yahoo!Finance:
“US stocks rallied Wednesday after President Trump said he has “no intention” of firing Fed Chair Jerome Powell, easing Wall Street fears over the central bank’s independence. Meanwhile, Trump also softened his tone on tariffs, hinting that eye-popping duty levels on Chinese imports would ultimately be scaled back.”
Quoting my yesterday’s analysis:
Markets are forward-looking by nature. The current gold price has likely already incorporated:
· The full impact of Trump’s tariffs (now at 145% for Chinese goods)
· The strained relationship between Trump and Powell
· The possibility of Powell’s removal
· The potential for higher inflation due to tariffs
· The increased likelihood of a global recession
When everyone expects an asset to move in one direction (in this case, higher for gold), there’s often no one left to buy at higher prices. (…)
The “Buy the Rumor, Sell the News” Effect
Financial markets often follow the “buy the rumor, sell the news” principle. In this case, gold has been rising on speculation about how tariffs and Fed policy might play out. Now that these situations are materializing, traders who bought on anticipation may begin selling on confirmation.
This effect is particularly pronounced when an asset has experienced a parabolic move like we’ve seen in gold. The overnight futures high of $3,509.06 could represent the crescendo of this buying frenzy.
Contrarian Considerations
From a contrarian perspective, when everyone appears to be bullish on an asset, it’s often wise to consider the opposite possibility. The fact that most analysts are raising price targets, and few are suggesting caution is itself a warning sign.
Moreover, gold’s outperformance relative to silver and mining stocks suggests smart money may already be reducing exposure to the precious metals complex.
Near-Term Outlook
Given these factors, a near-term correction in gold prices appears increasingly likely. Markets rarely move in straight lines, and even the strongest bull markets experience significant pullbacks. After such a dramatic rise, a 5-10% correction would be entirely normal and potentially healthy for the longer-term trend.
However, if we’re about to get a 2008-like slide in stocks, then gold, silver, and mining stocks could be affected to a much greater extent. In particular, silver and miners would be likely to get a major hit.
The tensions between Trump and Powell are unlikely to dissipate soon, but markets may have already factored in the worst-case scenarios. As concrete policies emerge and uncertainty decreases, gold might paradoxically lose some of its appeal as a safe haven.
Given gold’s huge slide from above $3,500, it seems that this is exactly what happened.
Trump is now backing out of the extreme positions and the markets are taking a big breath of relief.
However, what we got today is just an indication of Trump’s willingness not to remove Powell and “be nice to China”.
How it might have worked behind the scenes?
Well, remember about the little-talked-about clue coming from China? The ban on rare earths exports? On April 14, I wrote the following:
“So, Trump backed off a little, while China discretely flexed its muscles by halting exports of its rare earth minerals. The latter didn’t get enough media attention, but in my view, this likely ends the dramatic series of tariff hikes – at least for some time.
You see, those rare earth minerals are essential to produce many of high-tech goods. It’s all nice as long as the U.S. companies still have some in their inventories, but they will eventually run out of them and the regular business operations can be disrupted. Trump (or his team) knows that. And while Xi can easily get away with crashing stock market, Trump may not have this privilege.
That’s why in my view this might be the end of this tariff race. What’s likely to happen now? Both sides are likely to keep their stance in my view, and at some point (perhaps weeks or months away), some kind of deal will be made, but the tariffs will still be greater than they were a few months before.”
Now, fast forward to the current situation.
The markets tanked, and one could read that Tesla’s ability to produce humanoid robots will be severely disrupted by the lack of rare earth minerals coming in from China…
Perhaps Xi was simply following the rules of Sun Tzu’s Art of War – in particular, the rule, where it’s useful to attach your enemy’s plans and allies instead of a direct confrontation. In this case, Musk’s company was attacked.
Anyway, Trump just showed that when the stock market’s tank, he’s willing to completely change his rhetoric. Makes one wonder if he’s sometimes saying things on purpose, knowing that it will move market in a certain direction.
So, what’s likely to happen next?
As I wrote previously, we’re likely to have a move toward normalcy and markets might react positively to it while gold’s gleam becomes less appealing. That’s exactly what we see now.
However, while gold is moving down, the stock market and copper are up again. So are the bottoms in them in? Are the blue skies ahead?
No. This is just an emotional relief. The tariffs were not abandoned. They were delayed for most countries, and Trump now just said something vague about being nice and about lowering the tariffs. However, as a principle, the tariffs are still likely to stay much higher than they were in the pre-Trump era. And markets being forward-looking are likely to discount that and continue to decline as that’s ultimately limiting the world trade, economic growth, demand for commodities and companies’ profits.
Today, however, the markets appear to be in the “emotional celebration” mood. Of course, this will pass, and reality will kick in. In our case, this means declines in stocks and commodities alike.
And speaking of commodities, please note that it’s that time of the year when copper forms MAJOR tops.
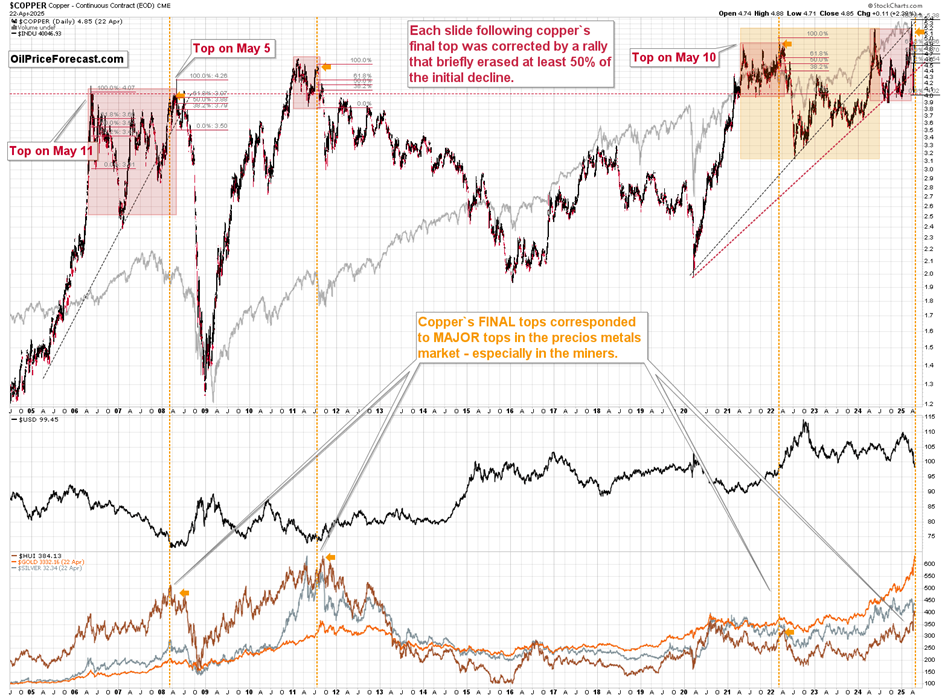
We are just a week and a day from early May – which is when copper tends to start its massive slides. Based on this simple, but remarkably accurate tendency, we’re likely to see the start of another powerful slide in copper in less than three weeks.
And given how volatile markets are, we don’t have to wait that long (or at all).
Copper’s Echo from 2008
There’s one more thing that I’d like you to focus on here – the size of the final pre-slide rebound in 2008.
While all corrections that happened after the first part of the slide took copper to at least the 50% retracement, the 2008 corrective upswing took copper a bit (and very briefly) above its 61.8% Fibonacci retracement.
Guess what?
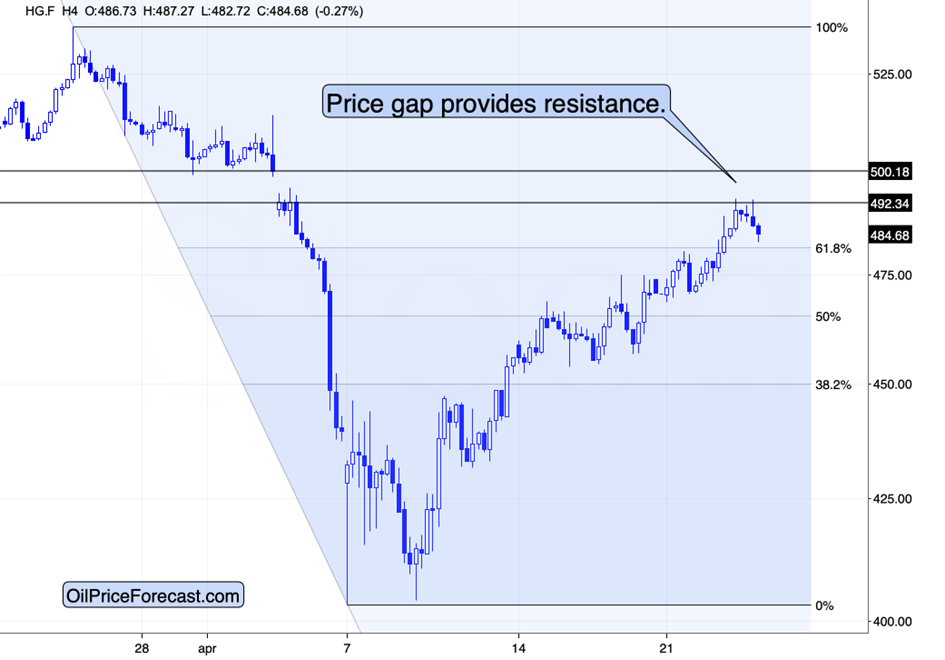
Copper just moved a bit above its 61.8% Fibonacci retracement! We just saw the same kind of event that was the final good-bye kiss to high copper prices in 2008. After that copper fell like stone in water, and the decline in FCX was even worse.
Another good question is:
– Are stocks topping here?
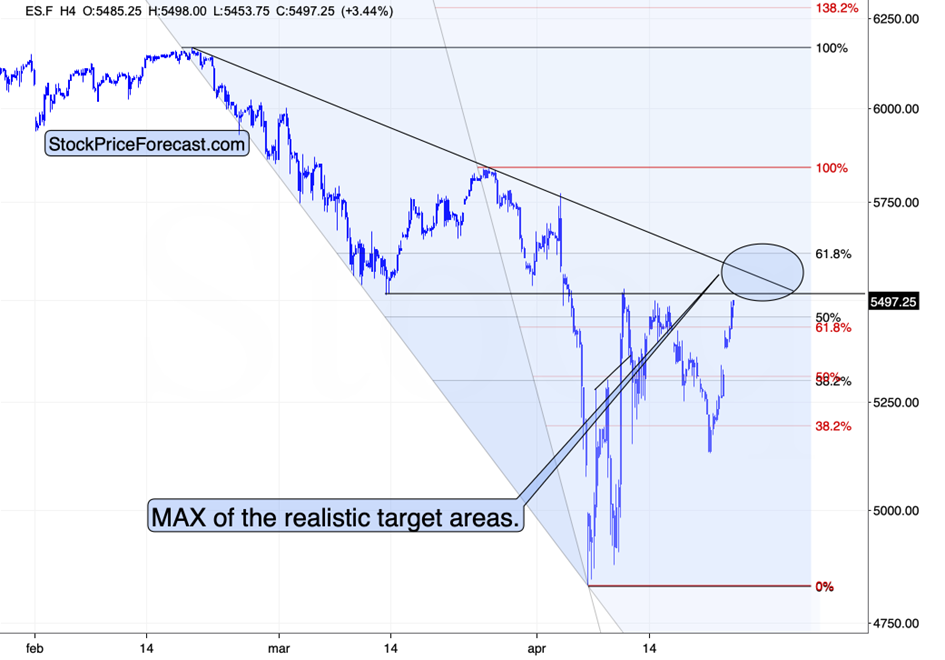
This could be the case, or they might rally a bit more before turning south again. I previously wrote about the 61.8% Fibonacci retracement as the likely maximum of the realistic upside target areas for stocks, and it’s just above the current S&P 500 levels. So, the upside is limited – the same goes for copper and FCX.
Having said that, let’s take a look at gold.

Yesterday, I wrote the following:
From a technical analysis perspective, gold is showing signs of buying exhaustion. The metal has become extremely overbought on momentum indicators, suggesting at a minimum a period of consolidation or correction is due.
After invalidating the move above $3,500, gold declined back to its second of the very short-term support lines. The third one is at about $3,400. Based on the “three-line break” technique, if gold breaks below $3,400 here, it will imply that the final top is indeed in. Given how extremely overbought gold has become, this appears to be the likely outcome (especially that neither silver, nor miners are really following gold higher here – at least they lagged significantly yesterday).
Breakdown Confirmed
Gold broke below $3,400 and even quickly declined below $3,300 – the top is in.
Gold is likely to remain volatile here – just like this was the case in 2008.
Meantime, please note that the USD Index is finally showing strength.
I previously wrote the following about it:
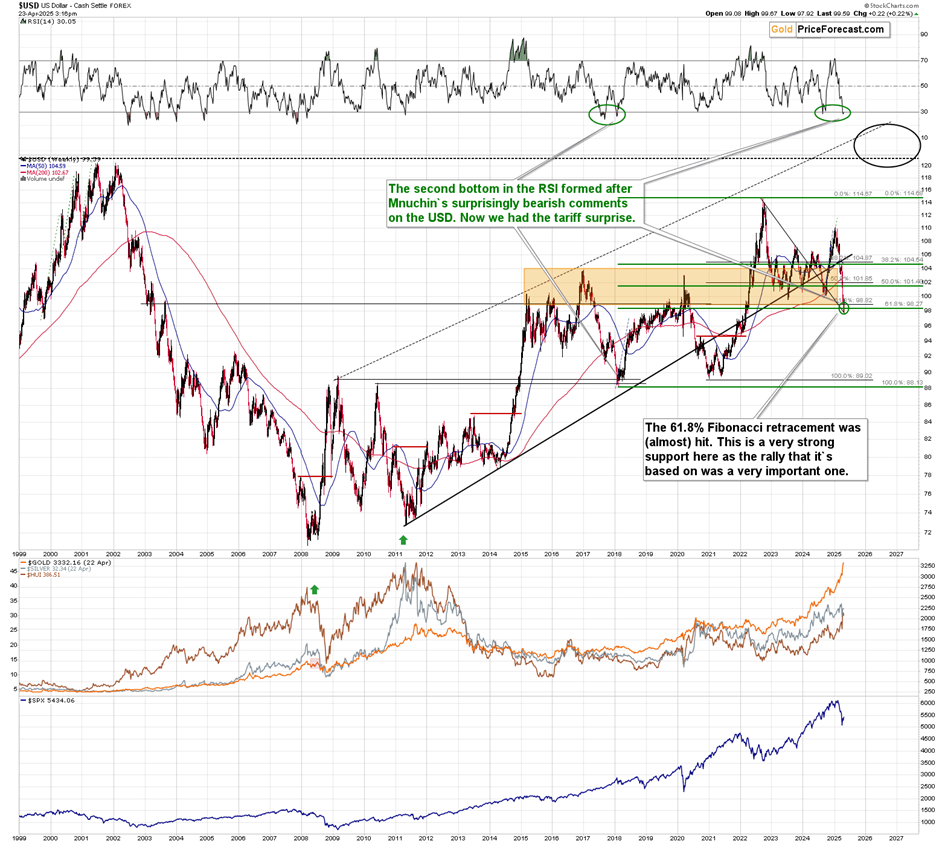
“The USDX started this week with a decline, and while this might seem discouraging, I would like to point out three critical facts:
1. This decline took the USDX to the 61.8% Fibonacci retracement based on the 2008 – 2022 rally, which provides VERY strong support. It was only somewhat below the same retracement but based on the 2020 – 2022 rally.
2. The breakdown below the 2020-2022 61.8% Fibonacci retracement was not confirmed.
3. The USD Index just reached its declining resistance line based on the 2022 and 2023 highs.
All three are very strong reasons for the USD Index to turn back up, and the fact that we have them together is truly exceptional (especially that the weekly RSI is now extremely undervalued).
This creates a very bullish outlook for the USD Index, which support our outlook in other market as well as our trading positions.”
The USD Index rallied above 99.5 today, which means that it just invalidated breakdowns below both 61.8% Fibonacci retracements, despite the extremely negative sentiment.
THE bottom in the USD Index is likely in. Perhaps, just like at the 2018 bottom – lower USD Index values will never be seen.
This is very bearish for the precious metals sector and for commodities.
Finally, I’d like to show you the silver chart.
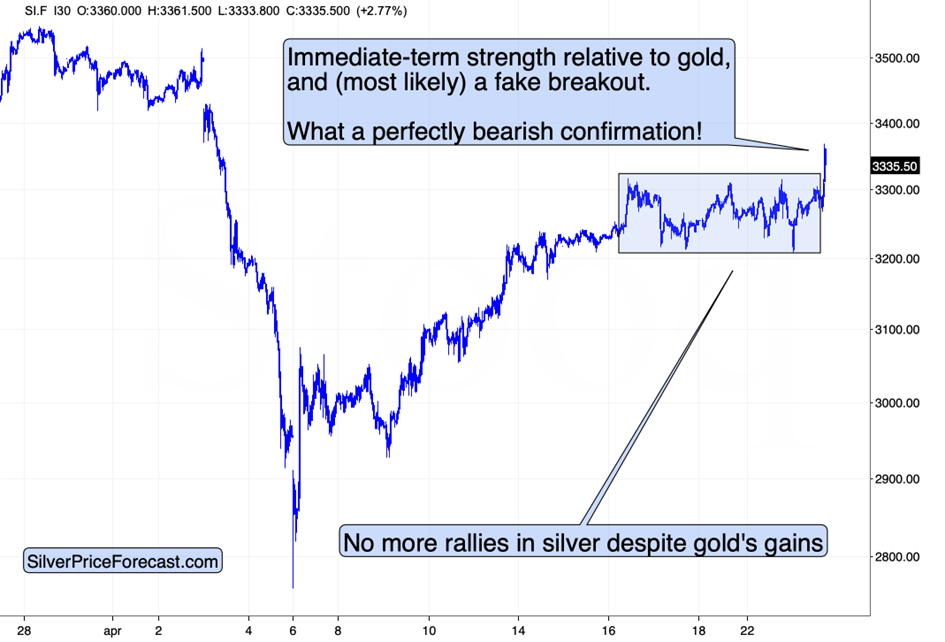
The white metal showed immediate-term strength relative to gold, and it just broke above the previous highs. Both are very bearish for the following weeks. Silver is known for fake breakouts and for sliding right after showing strength relative to gold. We just saw both.
FCX and silver were both laggards recently and they are both very strong today – this is likely NOT and accident. This is most likely a confirmation that it is the investment public that’s buying – those who buy at the tops.
This creates a tremendous opportunity for anyone that’s been at least considering making money on the upcoming declines. And even if you haven’t been considering that – it might be a good idea to consider closing long positions. And if that’s out of the question, too, then it might be a great idea to at least tighten one’s stop-losses.
You have been warned.
Thank you for reading the above free analysis. If you’d like to access my complete premium analysis, including specific technical targets for FCX (even options) and silver, detailed analysis of mining stocks, and comprehensive portfolio insights, consider subscribing to my Gold Trading Alerts. If you’re not ready to subscribe yet, I invite you to stay updated with our free analyses – sign up for our free gold newsletter now.
Thank you.
Przemyslaw K. Radomski, CFA
Founder, Editor-in-chief
About the Author
Przemysław Radomskicontributor
Being passionately curious about the market’s behavior, PR uses his statistical and financial background to question the common views and profit on the misconceptions.
Did you find this article useful?
Latest news and analysis


Advertisement