
Advertisement
Advertisement
NASDAQ Index, SP500, Dow Jones Forecasts – Stocks Pull Back From Session Highs As Traders Focus On Bessent’s Comments
By:
Key Points:
- SP500 moved away from session highs as traders evaluated Bessent's comments on U.S. - China trade war.
- NASDAQ faced resistance near the 19,000 level and pulled back.
- Dow Jones did not manage to settle above the resistance at 40,000 - 40,100.

SP500
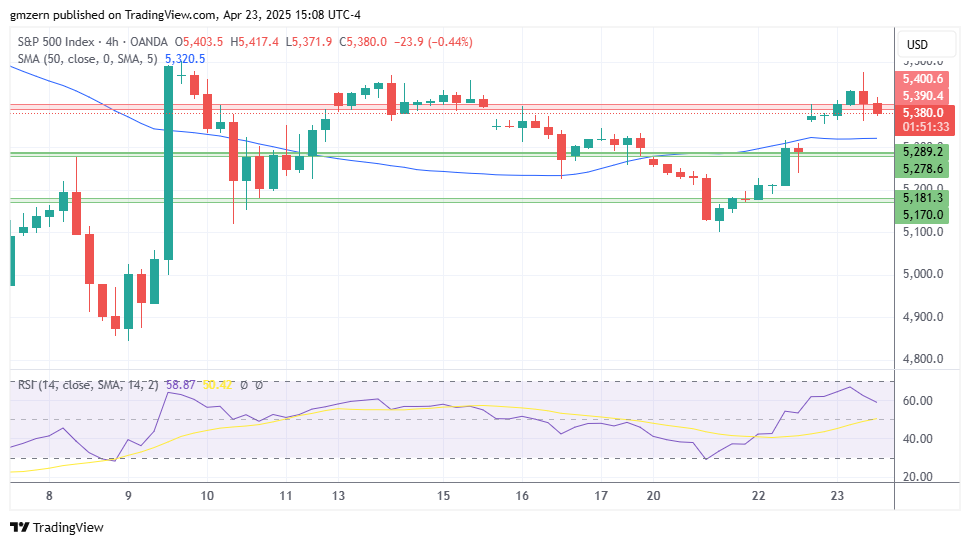
SP500 pulled back from session highs as Treasury Secretary Bessent said that the U.S. did not plan to reduce tariffs on China on a unilateral basis. Previously, U.S. President Donald Trump said that he could make a deal with China and cut tariffs. Importantly, Bessent added that rebalancing of the trade between U.S. and China may take two or three years, which also served as a negative catalyst for stocks. Today, traders also focused on PMI reports for April. Manufacturing PMI increased from 50.2 in March to 50.7 in April, compared to analyst forecast of 49.1. Numbers above 50 show expansion. Services PMI decreased from 54.4 to 51.4, compared to analyst consensus of 52.5. New Home Sales grew by 7.4% month-over-month in March, while analysts expected that they would grow by 0.2%. Trade war news will remain the key catalyst for SP500 in the near term, so the index will stay extremely sensitive to Donald Trump’s comments.
SP500 declined below the resistance at 5390 – 5400 and is moving towards the 50 MA at 5320. If SP500 settles below the 50 MA, it will head towards the support level at 5280 – 5290.
NASDAQ
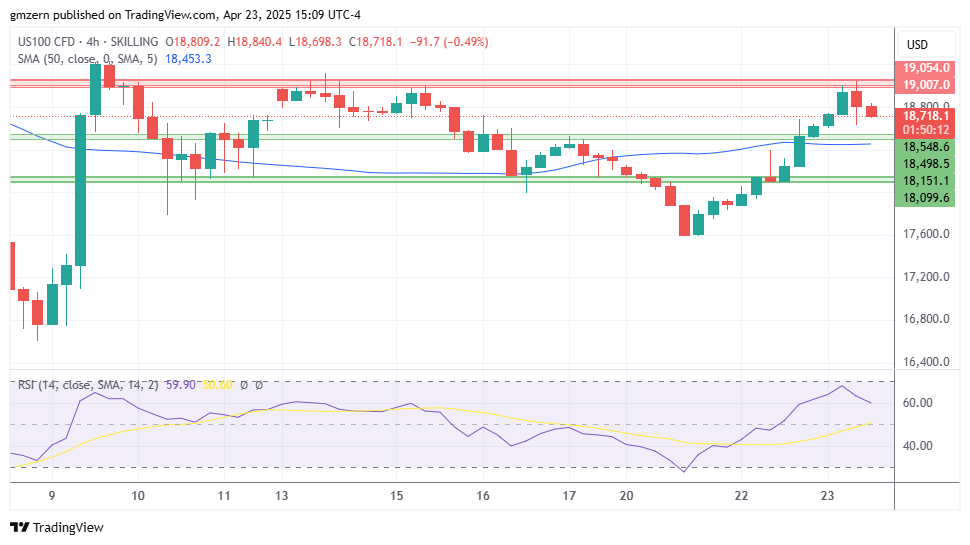
NASDAQ has also moved away from session highs as traders focused on Bessent’s comments. Tesla, which was up by 6.4%, was among the biggest gainers in the NASDAQ index today. The stock gained ground despite the disappointing quarterly report as Elon Musk promised to focus on Tesla instead of politics.
The nearest support level for NASDAQ is located in the 18,500 – 18,550 range. If NASDAQ declines below the 18,500 level, it will head towards the next support at 18,100 – 18,150.
Dow Jones
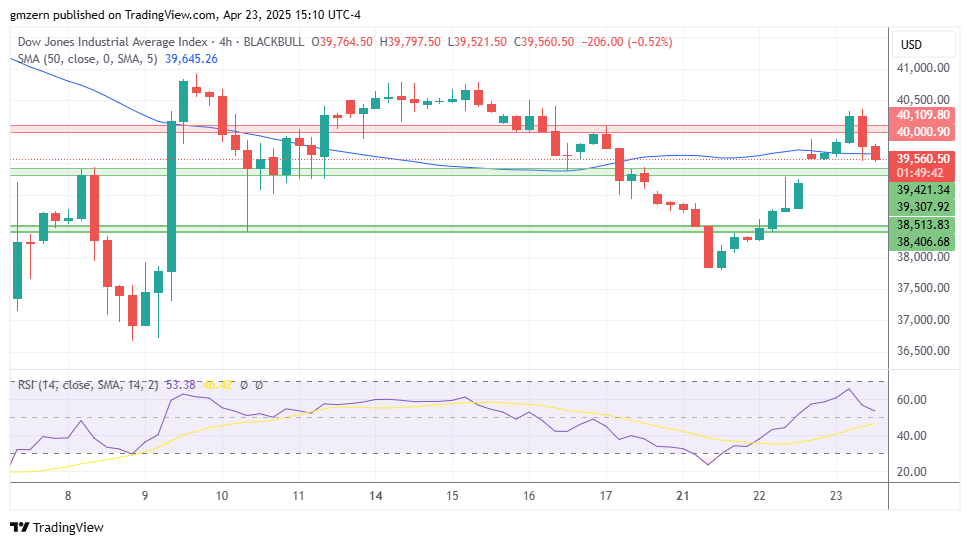
Dow Jones moved towards the 39,500 level after an unsuccessful attempt to settle above the 40,000 level.
In case Dow Jones declines below the support at 39,300 – 39,400, it will head towards the next support level at 38,400 – 38,500.
For a look at all of today’s economic events, check out our economic calendar.
About the Author
Vladimir Zernovauthor
Vladimir is an independent trader, with over 18 years of experience in the financial markets. His expertise spans a wide range of instruments like stocks, futures, forex, indices, and commodities, forecasting both long-term and short-term market movements.
Did you find this article useful?
Latest news and analysis


Advertisement