
Advertisement
Advertisement
Natural Gas Price Forecast: Will $3.00 Hold or Lead to Lower Prices?
By:
Price action suggests bearish control remains, but a decisive move above $3.07 could ignite a temporary rally within the broader downtrend.
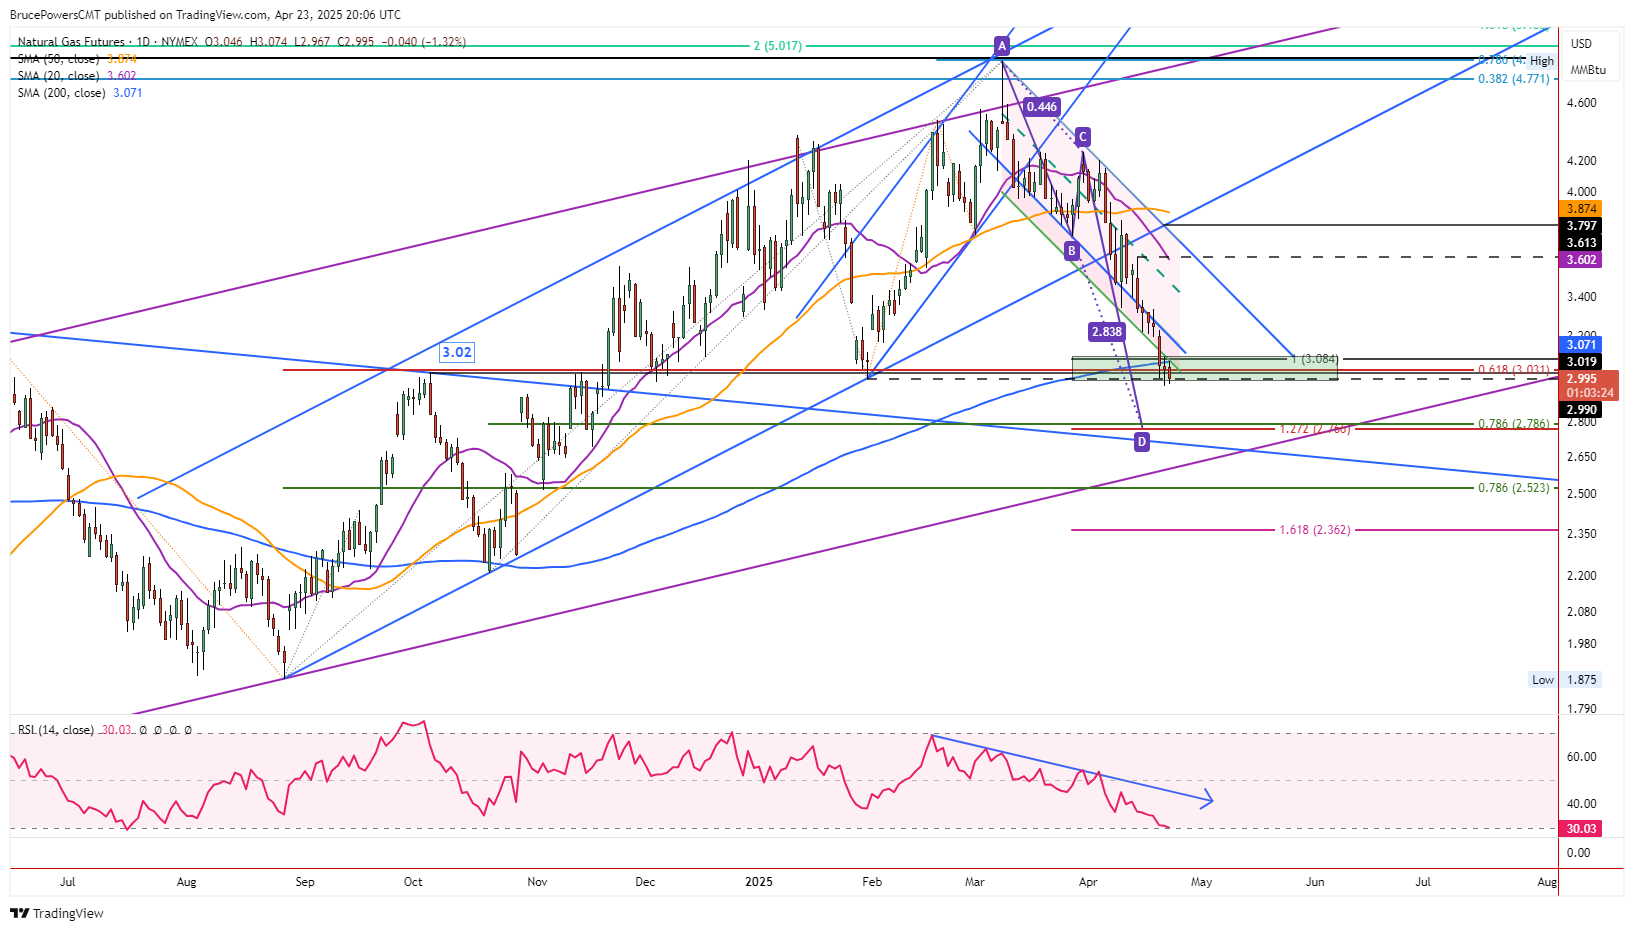
Natural gas consolidated on Wednesday and is set to complete an inside day. It is a concern that the day’s range of $2.97 to $3.07 has formed at resistance represented by the 200-Day MA. The high for the day hit the 200-Day line before sellers took back control. This is bearish behavior as prior support of the 200-Day MA was indicated as resistance today. It establishes a minor indication that the downtrend remains dominant and possibly ready to continue once there is further confirmation of weakness
Drop Below $2.96 is Bearish
A decline below today’s low will indicate weakness and will put Tuesday’s low of $2.96 at risk of failing to hold as support. If that happens, the next lower support zone becomes a target. That would be from $2.79 to $2.77, consisting of the 78.6% Fibonacci retracement and the 127.2% projection for a declining ABCD pattern, respectively. There are also two trendlines around the price zone that may provide additional indications of supply and demand.
Continues to Find Support
Despite the potential for a bearish continuation, natural gas has been stalled at a potential support zone around the late January higher swing low of $2.99. Although there was a brief dip below that low yesterday to a new trend low of $2.96, the breakdown has not yet been confirmed with a daily close below that low. Therefore, there remains the possibility that sentiment could change towards a short-term bullish posture.
Upside Breakout Indicated Above $3.07
A decisive rally above today’s high could provide an early sign of a potential bounce within the dominant downtrend. It would signal an inside day upside breakout as well as reclaim the 200-Day MA. If there is subsequently bullish confirmation with a daily close above the 200-Day line, further upside may be possible. Today is the eighth day since an inside day breakdown triggered a bearish continuation on April 11 and sellers have remained in control for most of those days. Therefore, a counter-trend bounce is due. Furthermore, keep an eye on the relative strength index (RSI) as it crosses into oversold territory.
50-Week Moving Average Support
There is another technical indication that current lows may hold as support. This week’s lows have also been testing support around the 50-Week MA, currently at $3.00. That is a long-term trend indicator. Since the 50-Week line was reclaimed in September there has only been one pullback to test it as support and that occurred relatively soon after the bull breakout. Not only does the 50-Week line indicate potentially strong support, but a sustained drop below it further adds to the potential significance of such a breakdown.
For a look at all of today’s economic events, check out our economic calendar.
About the Author
Bruce Powersauthor
With over 20 years of experience in financial markets, Bruce is a seasoned finance MBA and CMT® charter holder. Having worked as head of trading strategy at hedge funds and a corporate advisor for trading firms, Bruce shares his expertise in futures to retail investors, providing actionable insights through both technical and fundamental analyses.
Did you find this article useful?
Latest news and analysis


Advertisement