
Advertisement
Advertisement
AUD/USD, NZD/USD, and USD/JPY Analysis: Market Reactions to Fed Data and Trump’s Tariff Plans
By:
Key Points:
- AUD/USD remains bullish despite a correction from $0.6430.
- NZD/USD holds strong support at $0.5880.
- USD/JPY failed to break below 140 and rebounded due to oversold market conditions.

Global Tariff Uncertainty Supports Aussie Gains
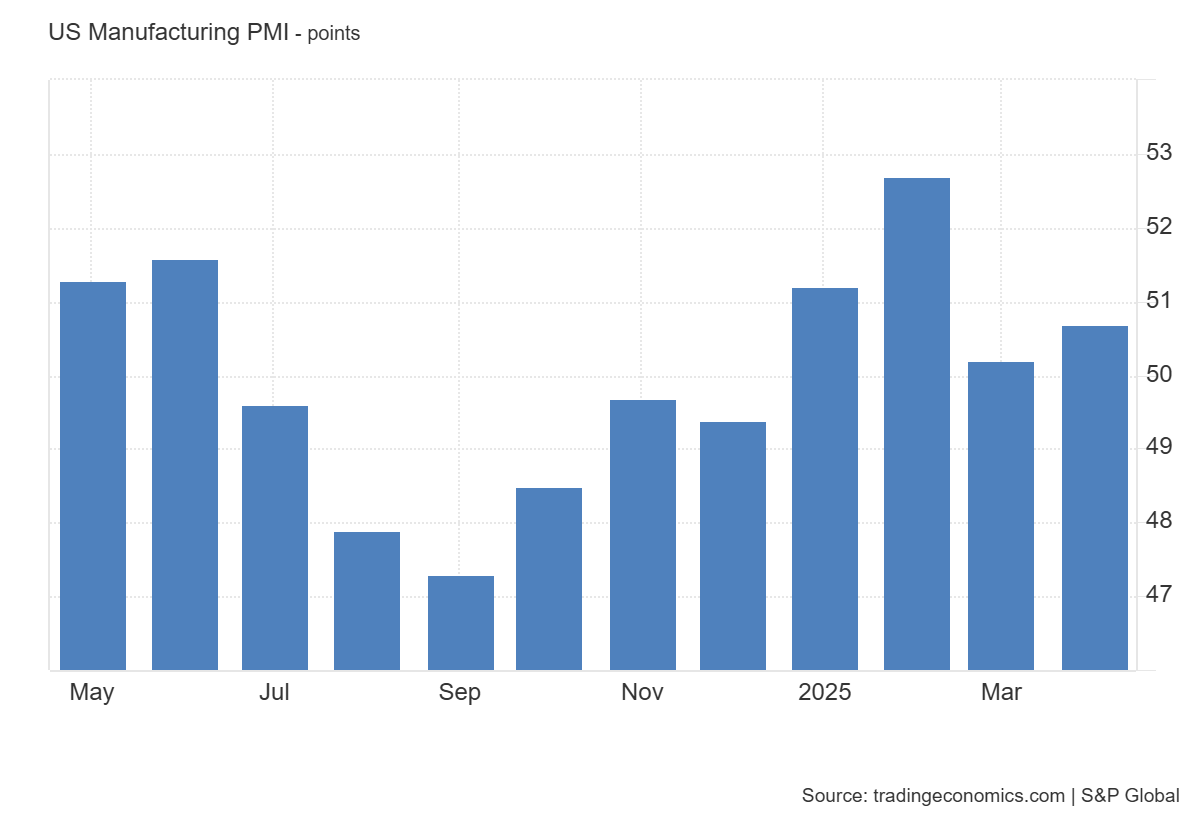
The Australian Dollar (AUD) remains strong despite two consecutive days of losses. Growing expectations of a weaker US Dollar drive this strength. The AUD/USD pair reached $0.6430 amid USD weakness, but a subsequent rebound in the Greenback has pushed the pair lower. The Federal Reserve’s April Beige Book signalled weakening economic conditions across several US regions, highlighting softening employment and mixed consumer spending. However, the US Manufacturing PMI rose slightly to 50.7 in April from 50.2 in March, as shown in the chart below.
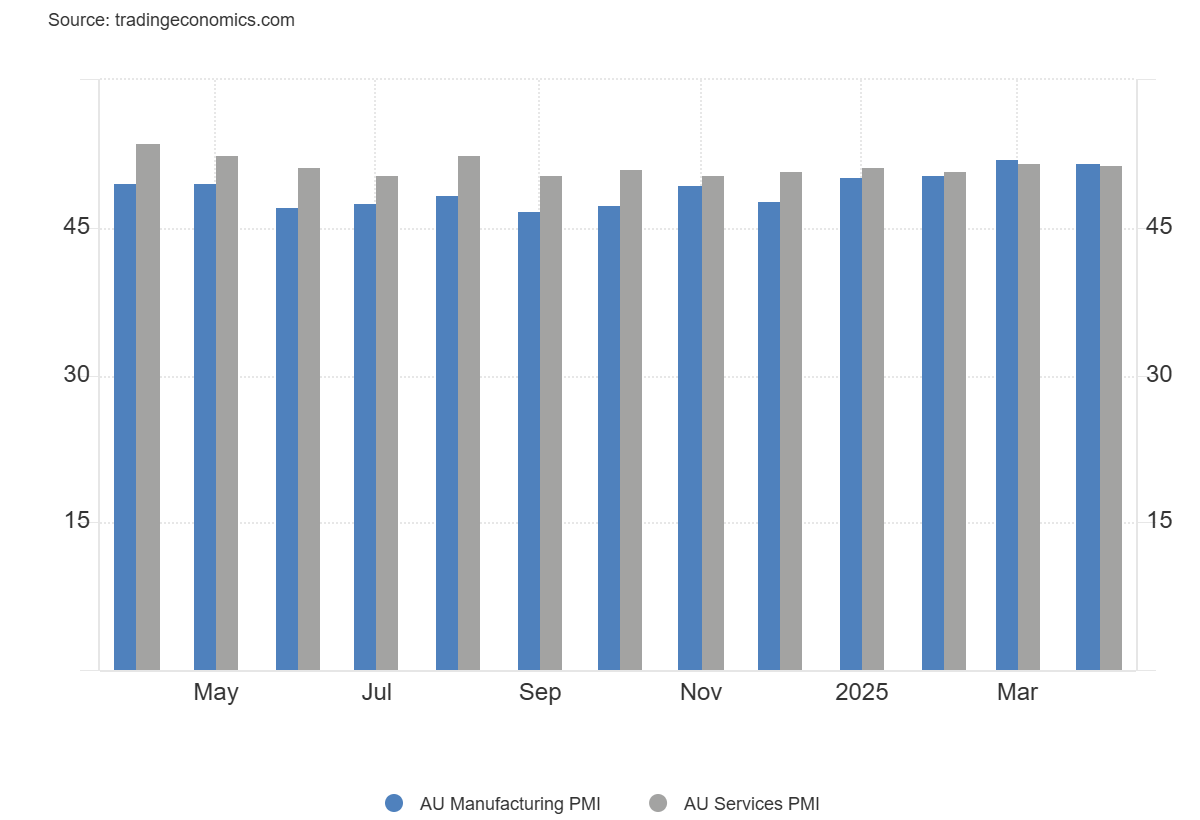
On the other hand, Australia’s data adds to the bullish outlook. Judo Bank reported seven consecutive months of private sector expansion. In April, the Manufacturing PMI eased to 51.7, and the Services PMI dipped to 51.4. However, both indicators remained in expansion territory, reflecting continued resilience in the Australian economy despite global challenges. The AUD/USD pair has found solid support, and with improving trade sentiment, the next target is near $0.65. If US economic data continues to weaken and tariff talks stall, the Australian Dollar could outperform the US Dollar.
USD/JPY Rebound May Fade as Bearish Pressure Returns
USD/JPY has rebounded from the key long-term support at 140 but remains under pressure amid global uncertainty. Broader concerns about the US economy and the Federal Reserve’s policy outlook continue to fuel volatility in the pair. The Beige Book and recent PMI data point to economic softening, which limits the potential for sustained US Dollar strength.
Moreover, President Trump’s latest tariff comments have added to market uncertainty. He stated that the US would decide on tariff rates for China within the next two to three weeks while emphasising that China would not trade with the US under the current 145% tariff rate. In addition, Fed Governor Adriana Kugler warned that elevated tariffs could fuel inflation. These mixed signals have complicated the outlook for USD/JPY. If the US Dollar faces renewed selling pressure, the pair could break below 140, potentially triggering a deeper decline.
AUD/USD Technical Analysis – Bullish Momentum
The 4-hour chart for AUD/USD shows that the pair rallied to test the resistance at $0.6430. This move was driven by uncertainty surrounding Powell in response to Trump’s earlier comments. However, Trump later clarified that he had no plans to fire Powell, which lifted the US Dollar Index from its oversold region and triggered a correction in AUD/USD from $0.6430. The pair remains highly volatile as tariff uncertainty continues to dominate market sentiment. A brief correction may lead to another advance toward the $0.65 level.

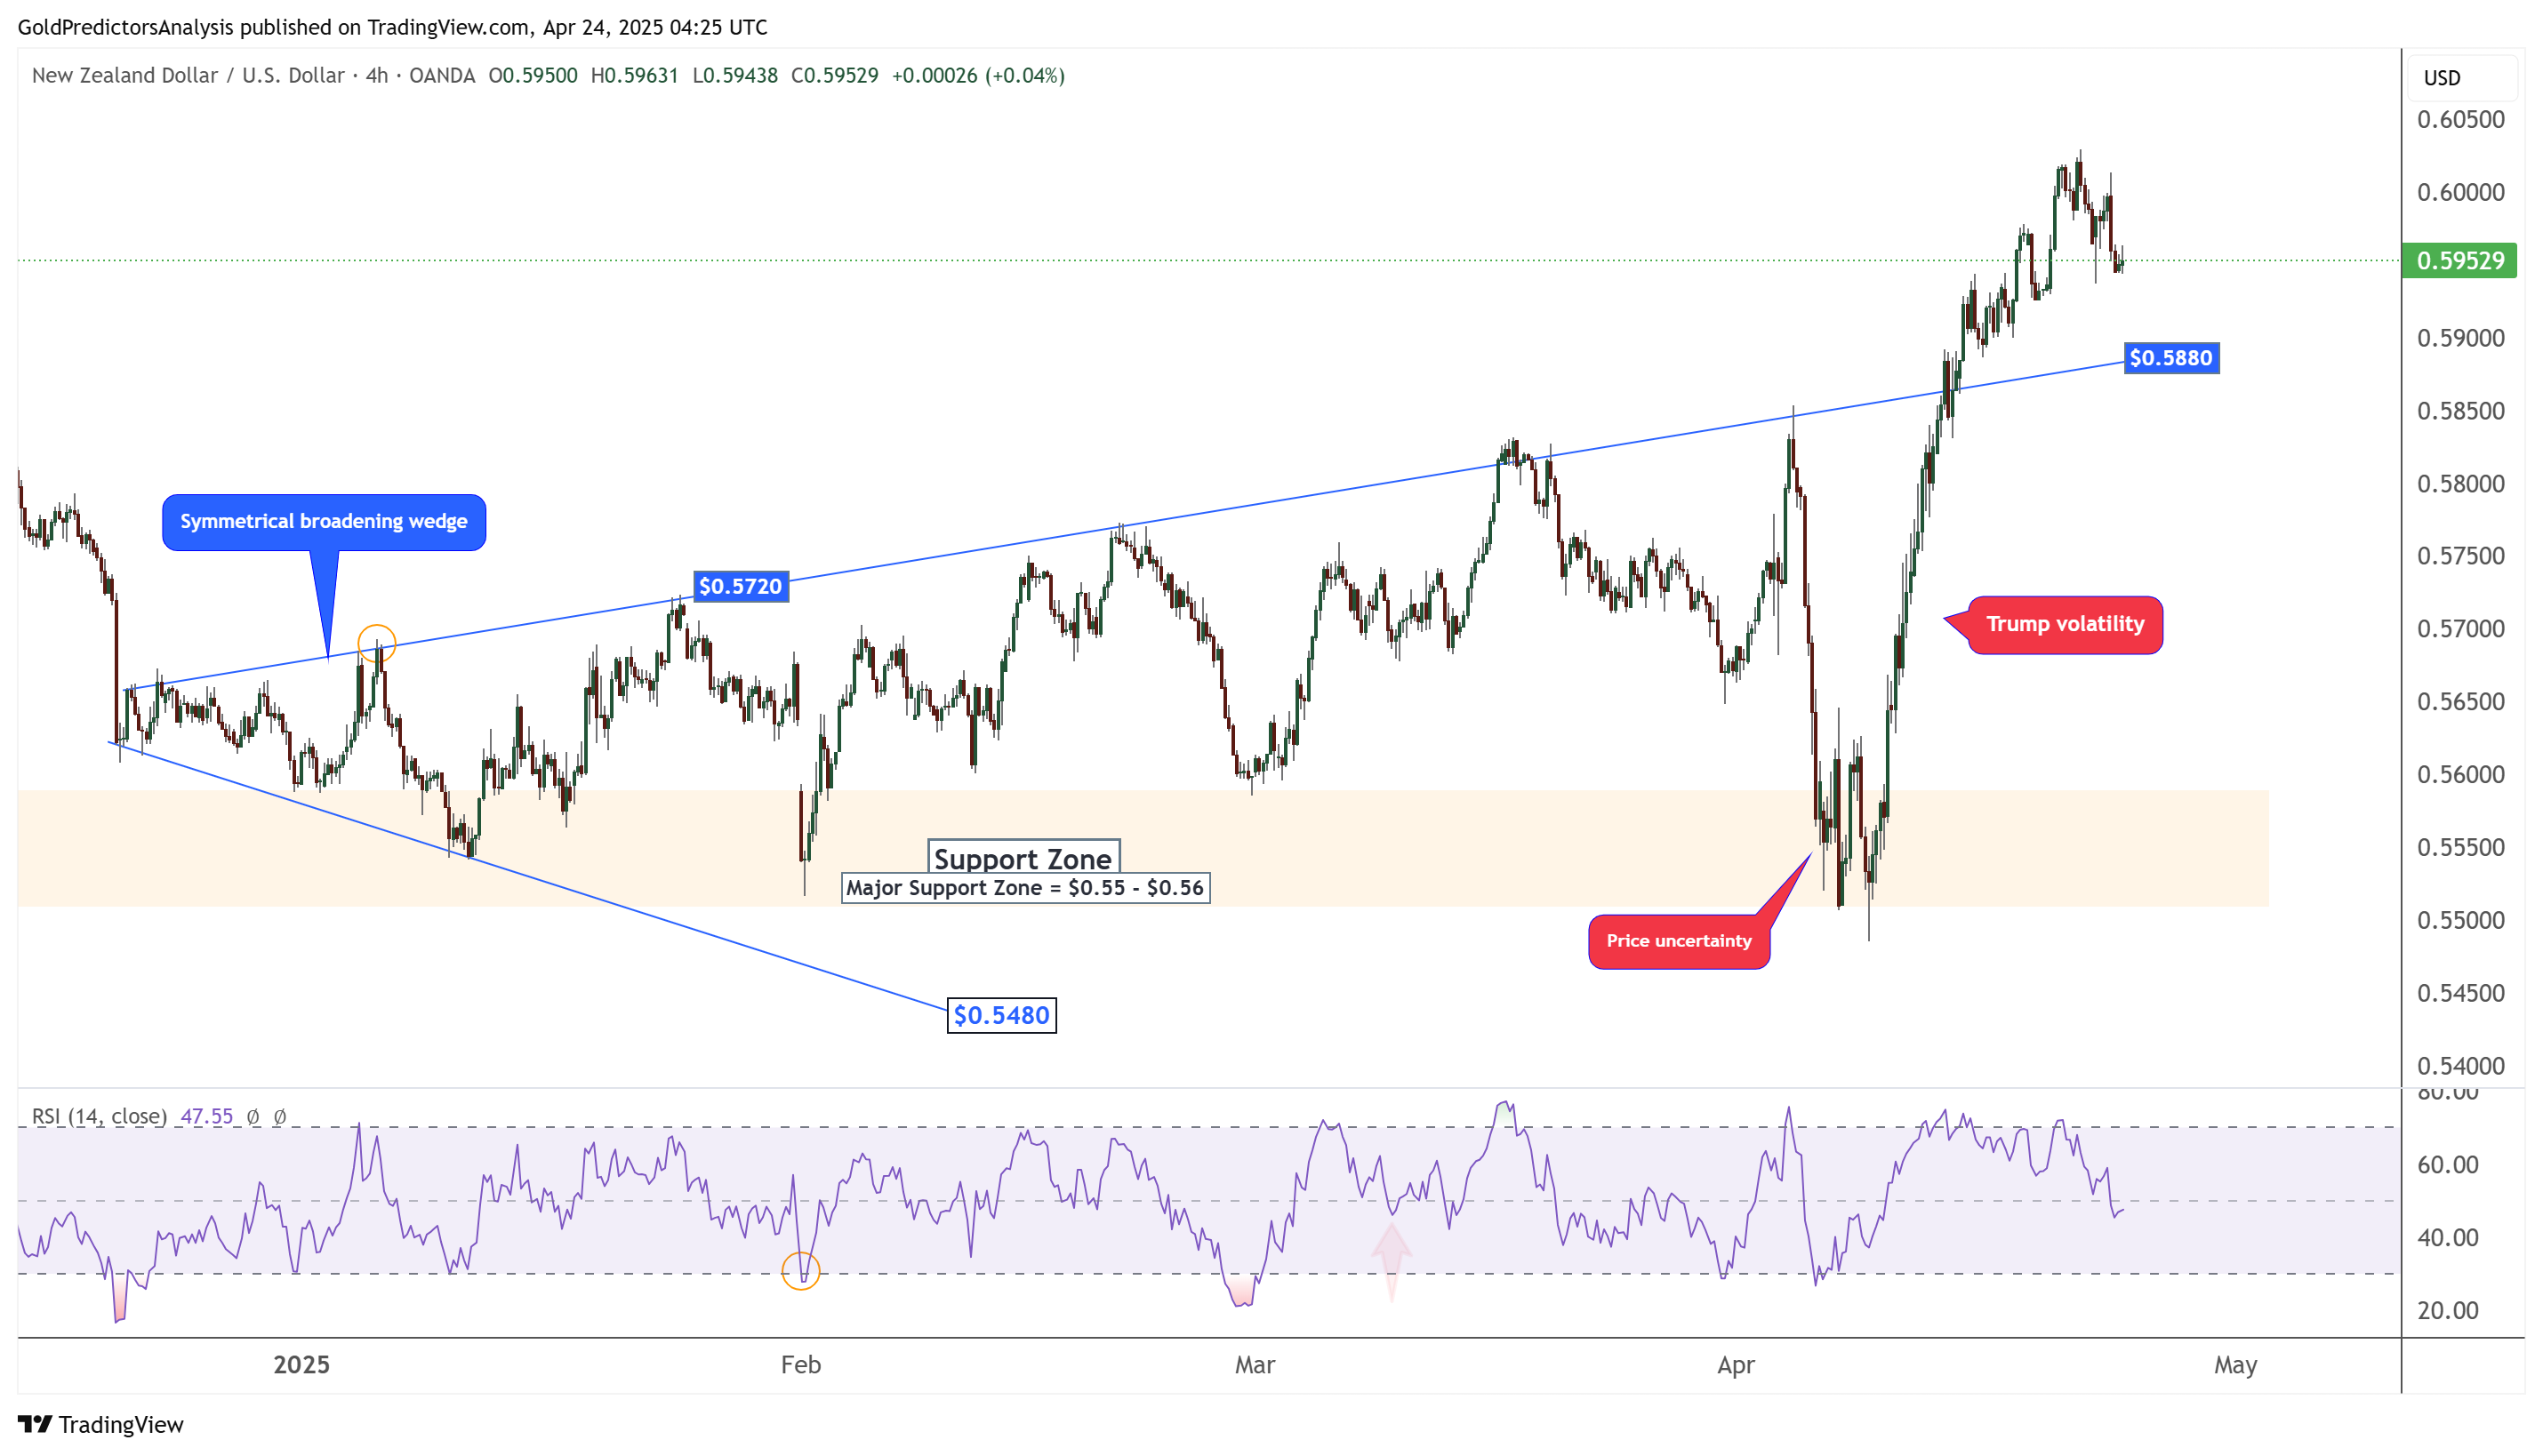
NZD/USD Technical Analysis – Bullish Momentum
The 4-hour chart for NZD/USD shows that the pair has broken out of a symmetrical broadening wedge pattern at $0.5860 and reached the resistance area near $0.60. The $0.5880 level remains a key support. A pullback to this support could trigger another strong rally in NZD/USD. Ongoing volatility in the US Dollar Index has added uncertainty to the pair’s short-term direction.
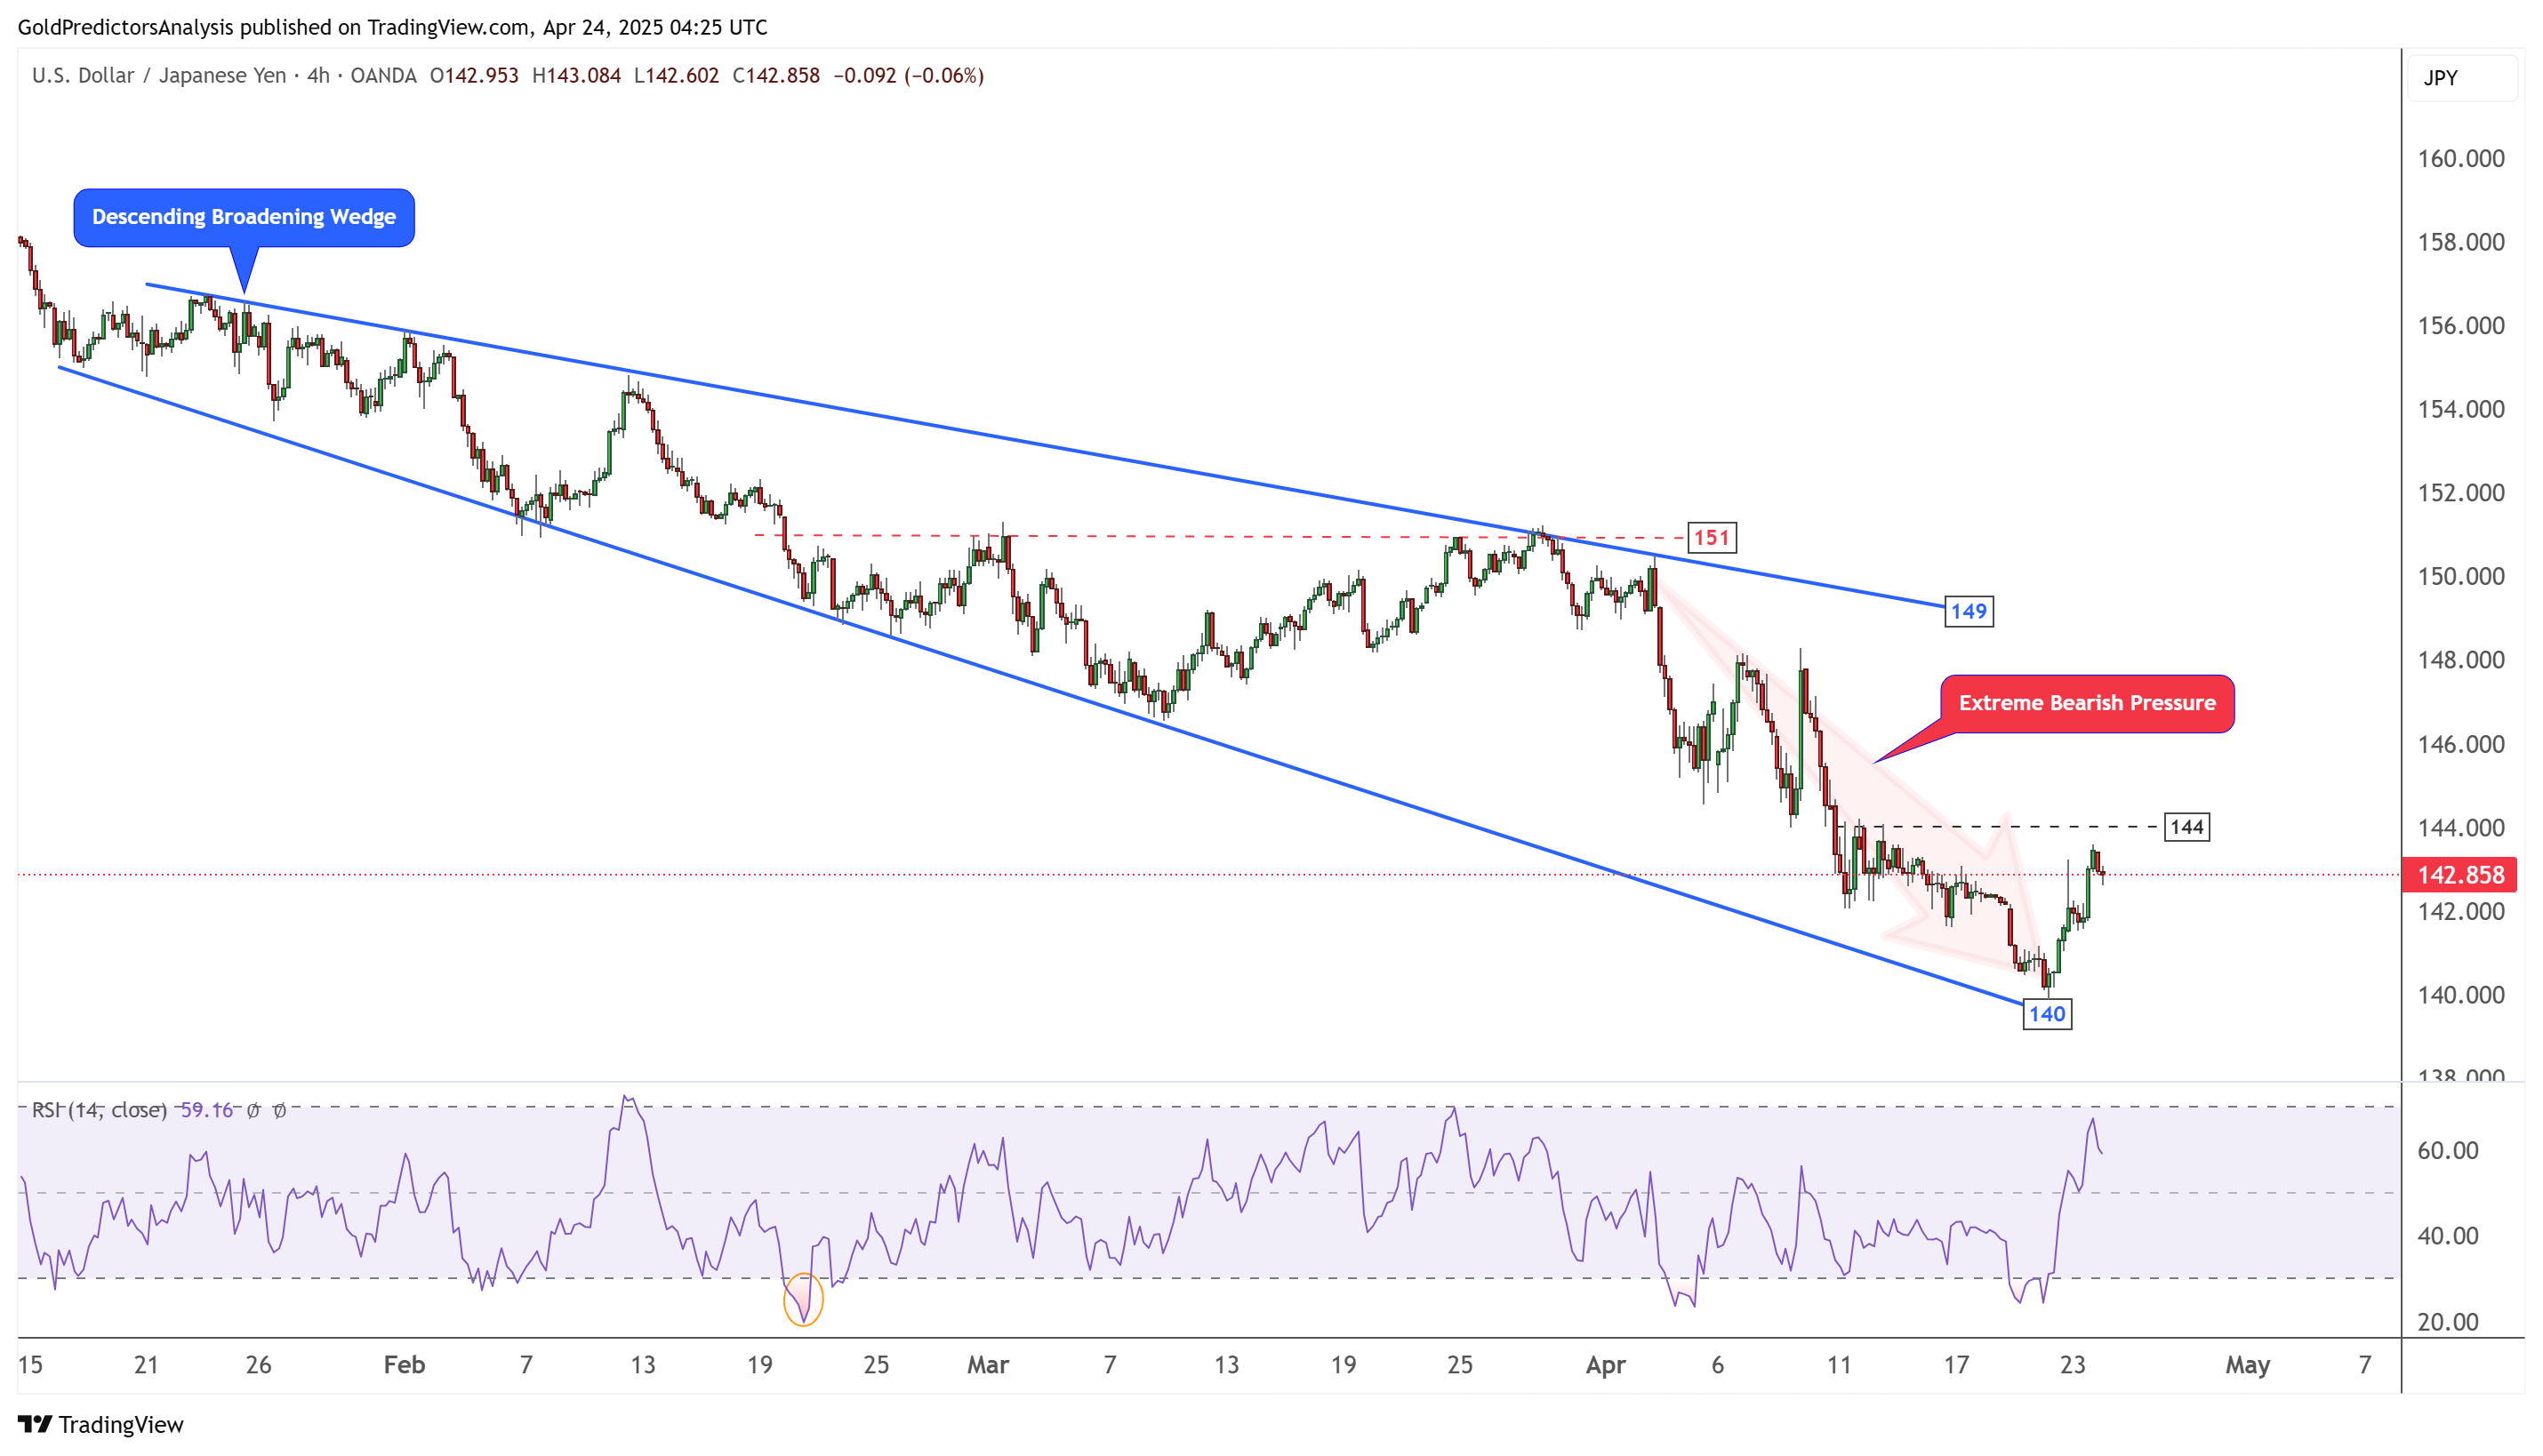
USD/JPY Technical Analysis – Descending Broadening Wedge
The 4-hour chart for USD/JPY shows that the pair failed to break below the long-term pivotal level at 140. This level also coincides with the support of a descending broadening wedge pattern. Upon testing 140, the RSI indicated strong oversold conditions, suggesting the rebound may have been driven by technical correction. If the pair fails to break above 144, it may continue to move lower. A break below 140 would likely trigger a sharp decline, as this is a significant long-term support level.
About the Author
Muhammad Umairauthor
Muhammad Umair is a finance MBA and engineering PhD. As a seasoned financial analyst specializing in currencies and precious metals, he combines his multidisciplinary academic background to deliver a data-driven, contrarian perspective. As founder of Gold Predictors, he leads a team providing advanced market analytics, quantitative research, and refined precious metals trading strategies.
Did you find this article useful?
Latest news and analysis


Advertisement